|
httpswww.ncbi.nlm.nih.govpmcarticlesPMC5361833
BMC #Anesthesiol. 2017; 17: 48.
Published online #2017 Mar 21. doi: 10.1186/s12871-017-0337-z
PMCID: PMC5361833
PMID: 28327093
#Continuous_Non-invasive_finger_cuff #CareTaker® comparable to #invasive_intra-arterial_pressure
in patients undergoing major intra-abdominal surgery
Irwin Gratz,1 Edward Deal,1 Francis Spitz,1
Martin Baruch,2 I. Elaine Allen,3 Julia E. Seaman,4 Erin Pukenas,1 and Smith
Jean1
Author information Article notes Copyright
and License information Disclaimer
This article has been cited by other
articles in PMC.
Associated Data
Data Availability Statement
The datasets generated during and analysed
for the current study are available from the corresponding author on reasonable
request.
Abstract
Background
Despite increased interest in non-invasive
arterial pressure monitoring, the majority of commercially available
technologies have failed to satisfy the limits established for the validation
of automatic arterial pressure monitoring by the Association for the
Advancement of Medical Instrumentation (AAMI). According to the ANSI/AAMI/ISO
81060–2:2013 standards, the group-average accuracy and precision are defined as
acceptable if bias is not greater than 5 mmHg and standard deviation is not
greater than 8 mmHg. In this study, these standards are used to evaluate the
CareTaker® (CT) device, a device measuring continuous non-invasive blood
pressure via a pulse contour algorithm called Pulse Decomposition Analysis.
Methods
A convenience sample of 24 patients
scheduled for major abdominal surgery were consented to participate in this IRB
approved pilot study. Each patient was monitored with a radial arterial
catheter and CT using a finger cuff applied to the contralateral thumb.
Hemodynamic variables were measured and analyzed from both devices for the
first thirty minutes of the surgical procedure including the induction of
anesthesia. The mean arterial pressure (MAP), systolic and diastolic blood
pressures continuously collected from the arterial catheter and CT were
compared. Pearson correlation coefficients were calculated between arterial
catheter and CT blood pressure measurements, a Bland-Altman analysis, and polar
and 4Q plots were created.
Results
The correlation of systolic, diastolic, and
mean arterial pressures were 0.92, 0.86, 0.91, respectively (p < 0.0001 for
all the comparisons). The Bland-Altman comparison yielded a bias (as measured
by overall mean difference) of −0.57, −2.52, 1.01 mmHg for systolic, diastolic,
and mean arterial pressures, respectively with a standard deviation of 7.34, 6.47, 5.33 mmHg for systolic, diastolic, and mean arterial
pressures, respectively (p < 0.001 for
all comparisons). The polar plot indicates little bias between the two methods
(90%/95% CI at 31.5°/52°, respectively, overall bias = 1.5°) with only a small
percentage of points outside these lines. The 4Q plot indicates good
concordance and no bias between the methods.
Conclusions
In this study, blood pressure measured
using the non-invasive CT device was shown to correlate well with the arterial
catheter measurements. Larger studies are needed to confirm these results in
more varied settings. Most patients exhibited very good agreement between
methods. Results were well within the limits established for the validation of
automatic arterial pressure monitoring by the AAMI.
Keywords: Non-Invasive, CareTaker, Central
blood pressure, Finger cuff, Intra-Arterial pressure
Go to:
Background
Accurate real-time continuous non-invasive
blood pressure monitors (cNIBP) can bridge the gap between invasive arterial
pressure monitoring and intermittent non-invasive sphygmomanometry. Latest
developments in this field promise accuracy and the potential to lower risk and
improve patient outcomes. However, a recent systematic review and meta-analysis
of 28 studies using non-invasive technologies by Kim et al. reported that all
failed to satisfy the limits that have been established for the validation of automatic
arterial pressure monitoring by the Association for the Advancement of Medical
Instrumentation (AAMI) [1]. According to this standard, the group-average
accuracy and precision are defined as acceptable if bias is not greater than 5
mmHg and standard deviation is not greater than 8 mmHg. Kim et.al. obtained
similar results when currently commercially available technologies were
examined [1]. In addition, ease of use and patient comfort issues have been
impediments to wider acceptance of current noninvasive cNIBP measurement
methods. Their results suggest that currently available devices may not have
the accuracy and precision for reliable clinical decisions, and there is a need
for better devices.
We evaluated the CareTaker® (CT) device
(Empirical Technologies Corporation, Charlottesville, Virginia) which has been
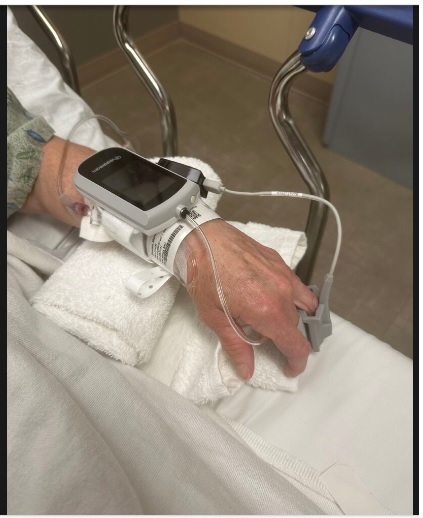
described in detail elsewhere [2]. Briefly, the CT is a physiological sensing
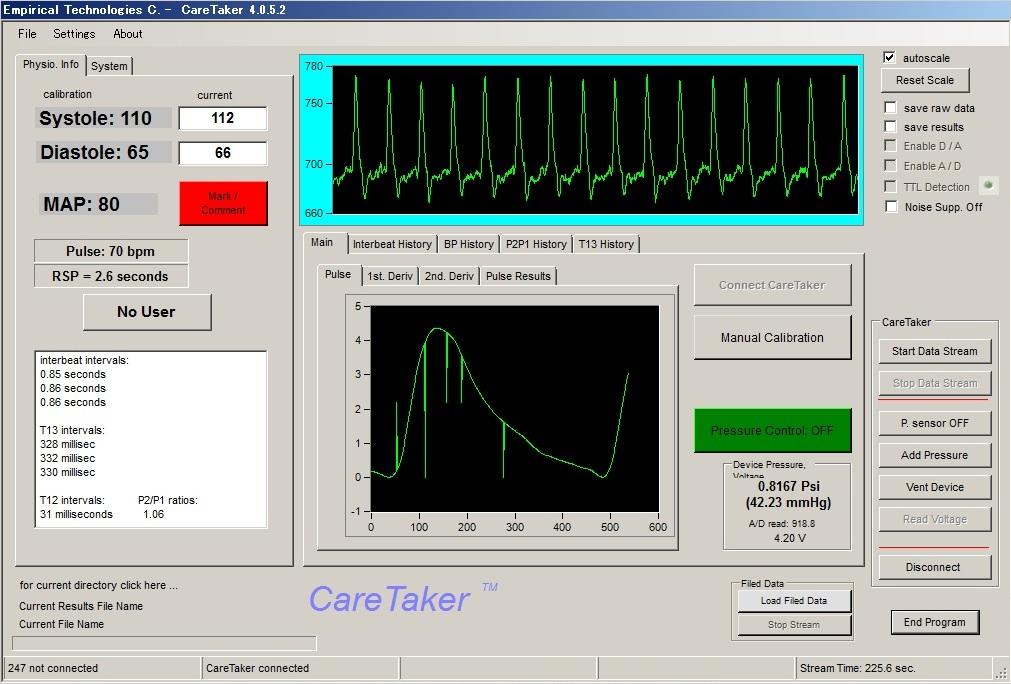
system that communicates physiological data wirelessly via Bluetooth (Fig. 1).
The device uses a low pressure [35–45 mmHg], pump-inflated, cuff surrounding
the proximal phalange of the thumb that pneumatically couples arterial
pulsations via a pressure line to a custom-designed piezo-electric pressure
sensor. This sensor converts the pressure pulsations, using transimpedance
amplification, into a derivative voltage signal that is then digitized at 500
Hz, transmitted to and recorded on a computer.
The CT measures continuous noninvasive
blood pressure via a pulse contour analysis algorithm called Pulse
Decomposition Analysis (PDA) [3]. It is based on the concept that five
individual component pressure pulses constitute the peripheral arterial
pressure pulse. These component pulses are due to the left ventricular ejection
and the reflections and re-reflections of the first component pulse from two
central arteries reflection sites [2] [4]. The first reflection site is the
juncture between thoracic and abdominal aorta, at the height of the renal
arteries, while the second site arises from the interface between abdominal
aorta and the common iliac arteries. The renal site reflects the pressure pulse
because the juncture of the aortic arteries there features significant changes
in arterial diameter and wall elasticity. The two reflected arterial component
pressure pulses, the renal reflection pulse (P2) and the iliac reflection pulse
(P3), counter-propagate with respect to the original pulse due to the left
ventricular contraction (Fig. 2) and arrive in the arterial periphery,
specifically at the radial or digital arteries, with distinct time delays [5].
The basic validity of the PDA model was recently corroborated in a detailed and
comprehensive arterial tree numerical modeling analysis [6] that examined the
effect of the different arterial segments of the central arteries, the iliac
arteries and beyond on the pressure/flow pulse patterns in the digital
arteries. The results clearly identified the central arterial reflection sites,
as opposed to more distal sites, as being the primary contributors to the pulse
patterns observed in the digits.
Quantification and validation of
physiological parameters is accomplished by extracting pertinent component
pulse parameters [7]. Since the device relies on pulse analysis to track blood
pressure, the coupling pressure of the finger cuff is maintained constant and
well below diastole, avoiding potential blood flow impediments.
The aim of the present study was to
specifically compare the non-invasive arterial pressure values obtained with
the CT to the reference invasive arterial pressure technique.
Go to:
Methods
The Cooper Health System Institutional
Review Board approved the study, and all subjects gave informed written
consent. Data from twenty-four adult patients requiring hemodynamic monitoring
during major open abdominal surgery were analyzed in this study. Patients were
not excluded due to other medical conditions.
Measurements were obtained during general
anesthesia in these patients starting with induction. The induction of
anesthesia was chosen because the blood pressure fluctuations and variability
typically found during this period provided an opportunity to compare tracking
accuracy under baseline and induced controlled dynamic conditions. The data was
evaluated using the ANSI/AAMI/ISO 81060–2:2013-related standards of accuracy
and precision [8].
Anesthesia procedure
After a stable signal was recorded,
patients were induced under general anesthesia by using propofol (2-4 mg/kg)
and fentanyl 250ug. Tracheal intubation was facilitated by the administration
of rocuronium (0.6 mg/kg). Mechanical ventilation was started using a volume
controlled ventilator to maintain an adequate saturation and an end-tidal
carbon dioxide of 35 mmHg. Inhalational anesthetic (Isoflurane) was added to
maintain a BIS monitoring of 40–45. Vasoactive drugs were used to maintain a
MAP greater than 60 mmHg based on the catheter value. Hemodynamic variables
were measured from both devices for the entire procedure. The MAP, systolic and
diastolic blood pressures were continuously collected from the arterial catheter
and CT and averaged over 10 s periods for both devices.
Invasive arterial pressure measurement
Standard arterial blood pressure monitoring
was performed prior to the induction of anesthesia using a 20G intra-arterial
catheter inserted in the radial artery under local anesthesia using ultra sound
guidance. The catheter was connected to a disposable pressure transducer with
standard low compliant tubing. The transducer was placed at heart level and
zeroed to ambient pressure. The transducer data was digitized, processed and
collected using the Datex-Ohmeda S/5 Collect system (Datex-Ohmeda Division,
Instrumentarium Corporation, Helsinki, Finland). For analysis, MAP, systolic
and diastolic blood pressures were averaged over 10 s intervals.
Non-invasive CareTaker arterial pulse
signal recording
The arterial pressure pulse signal was
continuously measured using the CT device. For this study the CT device was
calibrated using the arterial line blood pressure, but calibration can also be
based on non-invasive oscillometric or oscillometric/auscultatory measurements.
A fifteen second window at the start of the 30 min overlap section was used to
obtain an arterial stiffness reading averaged across 5 beats, which was then
used to calculate the PDA parameters for the blood pressure conversions (Fig.
2). With the exception of the four cases mentioned above, patient-specific PDA
parameters, once established, were not changed for the matching procedure,
irrespective of arterial stiffness or heart rate changes. On four occasions for
the entire data set, the offsets of the linear conversion equations were
changed as a result of persistent changes in arterial stiffness or heart rate
changes exceeding 30%. The PDA algorithm has recently been validated and
described elsewhere [6].
|


